Contribute
Register

[TOOL] VGTab: Control your Vega in macOS without flashing the vBios

Undervolting does not work... do a video to proof it with actual measurements.
I can run my V64 cards with PPT set to 700mV on highest power state and its perfectly stable. No change in temp or power consumption or fan speeds.

I may know why you have that experience.

Undervolt not necessary work like that.

Modern graphic card may has more than one loop in the ROM to pick up this kind of error.

I found this when I tried to undervolt a Polaris card. It seems I can push the voltage lower and lower, but then I realise once reach certain level, it will actually revert back to the original voltage. However, if assign a "workable" voltage, it's actually OK.

Of course, I don't think all card work like this, but just some card and some ROM. So, may be that's why you can't see any difference. But others seems OK.
 
I have quite some experience and I know how to do this. I can undervolt just fine under Windows and I know how the card would behave if it would work.
 
good morning, yesterday I installed my new Vega Nitro 64 replacing my Nvida, I made a clean installation of Mojave and everything seems to work well the first time without installing anything extra, natively everything perfect, I observe that the graphic does not make as much noise as people commented , is something that I think with the last update of mojave was corrected.
My first question ¿its necesary install in Multibeast Core Graphics Fixup AKA WhateverGreen ?
My second question is whether the VGTab application is really necessary in this version of mojave and if it is the system itself that regulates the speed of the fans, in case it is advisable to customize the speed, what values are you using?
And finally, how do you check the temperature of the Vega? the hardware monitor gives me wrong values 120º xD I touch it and it is not very hot without working or forcing the system. What program or modification of Hardware monitor you use to measure the temperature in real time ?, Thank you very much for your help
 
VGTab is not necessary anymore. Everything works out of the box. You only need to use a PowerPlay Table if you want to overclock the card now. For that I recommend using my Excel based generator for the PowerPlay Table since VGTab doesn't allow you to set the correct Fan PWM limit for your card which may result in fan speeds higher or lower than set by the driver. The correct PWM value for the Sapphire Nitro+ Vega 64 is 28.

Whatevergreen also is not necessary if everything is working. If not all outputs of the card work you need to apply AGDP patches (called black screen patch in Clover Configurator). Anyhow, you can also just use Whatevergreen, it doesn't do any bad.

Regarding the temps, you don't need any Kexts. If you have the GPUSensors Kext installed, remove it. macOS reads out the temperature on its own. You can either display them via Terminal with this command:
while sleep 1; do clear;ioreg -l | grep \"PerformanceStatistics\" | cut -d '{' -f 2 | tr '|' ',' | tr -d '}' | tr ',' '\n'|grep 'Temp\|Fan\|Clock\|Power'; done

Or just use iStat Menus which is capable of reading out the sensor values from IOReg including the clocks of your card. The values are displayed in the CPU tab of iStat.
 

Attachments

  • pptable_stable.xlsx.zip
    36.7 KB · Views: 197
VGTab is not necessary anymore. Everything works out of the box. You only need to use a PowerPlay Table if you want to overclock the card now. For that I recommend using my Excel based generator for the PowerPlay Table since VGTab doesn't allow you to set the correct Fan PWM limit for your card which may result in fan speeds higher or lower than set by the driver. The correct PWM value for the Sapphire Nitro+ Vega 64 is 28.

Whatevergreen also is not necessary if everything is working. If not all outputs of the card work you need to apply AGDP patches (called black screen patch in Clover Configurator). Anyhow, you can also just use Whatevergreen, it doesn't do any bad.

Regarding the temps, you don't need any Kexts. If you have the GPUSensors Kext installed, remove it. macOS reads out the temperature on its own. You can either display them via Terminal with this command:
while sleep 1; do clear;ioreg -l | grep \"PerformanceStatistics\" | cut -d '{' -f 2 | tr '|' ',' | tr -d '}' | tr ',' '\n'|grep 'Temp\|Fan\|Clock\|Power'; done

Or just use iStat Menus which is capable of reading out the sensor values from IOReg including the clocks of your card. The values are displayed in the CPU tab of iStat.


Forgive my clumsiness, I am very grateful for your answer, would you be so kind to explain to me how to do this step?

[You only need to use a PowerPlay Table if you want to overclock the card now. For that I recommend using my Excel based generator for the PowerPlay Table since VGTab doesn't allow you to set the correct Fan PWM limit for your card which may result in fan speeds higher or lower than set by the driver. The correct PWM value for the Sapphire Nitro+ Vega 64 is 28.]

The rest of the information is clear to me, thank you very much.
 
The PWM Limit is kind of a calibration value for the fans of your card. It is different depending on the vendor of the card. If the PWM Limit doesn't match the card, the fan speeds will be wrong. So if the driver sets a certain fan speed it can be either too slow or too fast, resulting in either overheating issues or the fans being louder than necessary. VGTab doesn't allow you to change the PWM Limit value which is one of the reasons why this tool shouldn't be used. Another reason is the dummy kext it creates that overrides part of the AMD driver, which can become an issue when Apple updates the driver.

Generating the PowerPlay Table for your card with my Excel sheet not only allows you to change the PWM Limit value to match your card, it also offers you more parameters to play with (you likely won't need them tho). In addition, since the inject isn't done with a Dummy Kext but through Clover device properties instead, it is a much more clean and update proof way to use a PowerPlay Table.

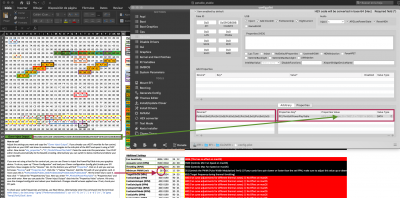
Can you confirm if these are the right steps? I'm afraid I do not do well and cause damage to my card.
Should I copy the line Clover inject output into properties value as is in clover?is this correct line that the putting into the properties value column??
B6020801005C00E1060000902C00001B004800000080A90300F0490200320008000000000000000000000000000002015C004F02460294009E01BE0028017A008C00BC0100000000720200009000A8026D0143019701F04902007102020200000000000008000000000000000500070003000500000000000000010820038403B603E8031A044C047E04B0040101460501018403000860EA00000040190100018038010002DC4A010003905F010004007701000590910100065CD40100070108D04C01000000800000000000001C83010001000000000000000070A7010002000000000000000088BC0100030000000000000000C0D40100040000000000000000442302000500000000010000000058020006000000000100000040900200070000000001000000000560EA00000040190100008038010000DC4A010000905F0100000008286E0000002CC9000001F80B0100028038010003905F010004F491010005D0B0010006C0D401000700086C39000000245E000001FC85000002ACBC00000334D0000004686E0100050897010006ECA30100070001683C01000001043C41000000000050C3000000000080380100020000B0AD01000500000108009885000040B5000060EA000050C300000180BB000060EA0000940B010050C300000200E10000940B01004019010050C300000378FF0000401901008826010050C300000440190100803801008038010050C300000580380100DC4A0100DC4A010050C30000060077010000770100905F010050C300000790910100909101000077010050C300000118000000000000000BE412AC0DAC0D4B001C00540390019001900190019001900190010132003700020123075E015E015E01510100005B0069004A004A005F007300730064004000000097609600905500000000000000000000000000000000000202D4300000021060EA00000210

I do not handle well with Excel and I do not know if it is correct to copy the entire line and how to select it whole if that is the case.
 

Attachments

  • Captura de pantalla 2019-07-11 a las 20.27.41.png
    Captura de pantalla 2019-07-11 a las 20.27.41.png
    494.5 KB · Views: 180
Last edited:
This is correct :)
 
This is correct :)

these are the values that shows me by terminal:

"Fan Speed(%)"=49

"Core Clock(MHz)"=31

"Memory Clock(MHz)"=500

"Fan Speed(RPM)"=0

"Temperature(C)"=42

the two programs to measure Hardware Monitor temperature as Istat shows me temperature of the gpu 127º fixed Is it normal?
 
As I said, you need to remove the GPUSensors Kext for iStat to work properly. You also might need to completely(!) uninstall iStat and re-install it again for it to display the correct values.
 
Back
Top