Contribute
Register

[Success] AMD RX6000 Series working in macOS

The correct boot argument is agdpmod=pikera.

Using the ATY,Carswell DeviceProperties with your RX6900 is probably the best method for configuring the card.

It sounds like the sensors are not being read correctly in your system. A CPU can’t work at 270%, that is a physical impossibility.
It's a case of percents-of-what: For example, Activity Monitor can report CPU load relative to a core (not a chip or HW thread) so if you see a readout of a process using 270% that means 2.7 cores of load.
 
That is a mangled and incorrect way to use percentages.

The CPU can only provide 100% when running at it’s maximum, with all cores/threads running at 100%. So the sensor saying the CPU is working at 270% is just nonsense. If it said 2.7 cores/threads were working at 100% that would be better, or gave that as a percentage of the CPU max, i.e. on a 6-core CPU 2.7 cores would be equivalent to 45% of the CPU’s maximum output.
 
That is a mangled and incorrect way to use percentages. The CPU can only provide 100% when running...

You are overlooking the possible meanings of the term "CPU" with respect to the unit of the measure.

What is a CPU? Is it the whole mac? A package that goes in a socket on a board? A die in a package?

Consider Activity Monitor, which regards the relative unit of measure of CPU utilization to be a core. The reason for this becomes obvious when we examine the system structure and try to define it any other way.

A core is a primary and distinct program execution device that can be scheduled to do work on behalf of a process. This makes it a natural unit convenient to the measure of processing workloads, while leaving out irrelevant packaging details of particular HW.

We can imagine that if all Macs had the same number of processors, we might normalize 100% to the Mac. But Macs have different numbers of processors, internally processes are scheduled by cores, and CPU utilization is a purely internal measure of Mac utilization, not a benchmark (by which an by which we compare different Macs).

But for the sake of argument, let's try to give your view regarding percentages the benefit of the doubt: Might we be more comfortable imposing some reference Mac (say the local Mac) as 100%?

Consider Activity Monitor as the sensor, so to speak. By definition it very usefully reports "process" activity. To be clear this is related to but not the same as "processor" activity. Processes may or may not span processors or cores. Internally there are various HW and programmatic boundaries that enable distribution of a process across multiple processing units and a program has to be specifically designed to run on multiple cores at once. Knowing such details, we can see that normalizing 100% process utilization to the totality of cores leads to confusion not clarity: The operator looking at the sensor readout, which is per-process, will need to divide the reported utilization by the total number of cores in the Mac to grok the utilization. E.g., imagine an 8-core Mac where Activity Monitor reports a process is consuming 12.5% of the CPU. Does it seem obvious to any reader of this stat that the processes is fully utilizing a core. No. Moreover, I have to communicate the per-Mac core count to allow comprehension of the stat in any other context.

Ok but just to continue for the benefit of the doubt, let's replace Activity Monitor with some other more general CPU sensor: one that just reports processor utilization per socket or die or something generic about the HW packaging. Is that helpful? Now we've decoupled the utilization measure from any comprehension of the internal programmatic details of process execution. You could convey processor utilization as momentary package power expressed as a percent of total power and just leave it up to the user to apply some enormous equation to work backwards from power consumption to a program's behavior! Does that make sense? For what purpose?

So it's truly just a matter a of percent-of-what, where normalizing "CPU" to something other than a core makes the CPU utilization report less grokkable.
 
Nice write up and good to read your thoughts on the matter. But, and there is a big but!

Since my A-Level days (early 1980's) when I studied Pure Maths, Maths & Statistics & Computer Science I have understood what Percentage means and stands for. This also includes understanding what a CPU (Central Processing Unit) is, even if they have changed dramatically since that time.

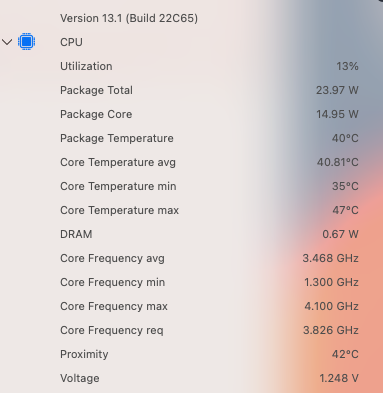
As a measure, 100% stands for the whole unit, in this case a CPU. It doesn't stand for a single core or thread, but is a measure of the Utilisation of the whole unit. As can be seen in this screenshot showing the Utilisation of the CPU in the CFL Hack I am currently using.

Screenshot 2022-12-14 at 19.52.32.png HWMonitorSMC2 showing 13% utilisation of the CPU.

This is a correct use of the Percentage function, where the percentage of the whole CPU in use is reported.

The person(s) who setup the monitoring kext/app or whatever @Delon2541 is using has simply set it up wrong. The developers have misconstrued the Percentage function, and obviously don't understand that the CPU cannot be utilised more than 100%. It is simply impossible.
 
Nice write up and good to read your thoughts on the matter. But, and there is a big but!

Since my A-Level days (early 1980's) when I studied Pure Maths, Maths & Statistics & Computer Science I have understood what Percentage means and stands for. This also includes understanding what a CPU (Central Processing Unit) is, even if they have changed dramatically since that time.

As a measure, 100% stands for the whole unit, in this case a CPU. It doesn't stand for a single core or thread, but is a measure of the Utilisation of the whole unit. As can be seen in this screenshot showing the Utilisation of the CPU in the CFL Hack I am currently using.

View attachment 559947 HWMonitorSMC2 showing 13% utilisation of the CPU.

This is a correct use of the Percentage function, where the percentage of the whole CPU in use is reported.

The person(s) who setup the monitoring kext/app or whatever @Delon2541 is using has simply set it up wrong. The developers have misconstrued the Percentage function, and obviously don't understand that the CPU cannot be utilised more than 100%. It is simply impossible.

Hi. Don't get me started on Percentage's sibling - Percentile !!!! That one I really dislike! :lol:
 
My sapphire vega 64 nitro+ just died on me after 5 years of use. Guess it's time to upgrade... I am planning to get a RX6800 or RX6800 XT. I know the community often recommends Sapphire but to be honest, I was never really satisfied with the Sapphire Vega. It war very hot and noisy and pretty unstable, even in windows where it would often green screen in the middle of a game with default settings... Also build quality was very plastic & shitty fans. So I would like to change brand.

It is for use in a pro music studio (not willing to spend 10k on a mac pro hahaha!) so fan noise is an important factor, with 4 screens, but also for the occasional gaming after sessions.

My system is running Big Sur on Opencore.

I have my eyes on the Powercolor Red Dragon 6800 XT which is going for 700 € on Amazon.fr

Seems like a good deal... I saw a few reviews on youtube and the consensus seems to be that Powercolor makes very good cards with good cooling and noise, and uses more metal for it's shouds than sapphire cards. Also no RGB on the red dragons model, which I prefer.

Has anyone tried this model? Is it stable?
And is it plug and play or will I need to re-install Mac OS?
 
I'm here to ask for help with the 6900XT (XTXH variant, Asus in this case). I'm on a Asrock B660M-HDV, BIOS 10.04, using my guide (https://github.com/dclive/B660M-HDV---i5-1200F), albeit with updated OC87 versions OpenCore and all kexts, validated by OCValidate as good, and happily working with an AMD 5700 under 13.1.

Now, I've removed the 5700 and added the 6900 XT (XTXH, remember) to this system, and so I see:

  • GFXUTIL:
  • ./gfxutil -f gfx0
    03:00.0 1002:73af /PC00@0/PEG1@1/PEGP@0/pci-bridge@0/GFX0@0 = PciRoot(0x0)/Pci(0x1,0x0)/Pci(0x0,0x0)/Pci(0x0,0x0)/Pci(0x0,0x0)

  • Hackintool shows the following on PCI tab:
  • IOREG path: IOService:/AppleACPIPlatformExpert/PC00@0/AppleACPIPCI/PEG1@1/IOPP/PEGP@0/IOPP/pci-bridge@0
  • DEVICE path: PciRoot(0x0)/Pci(0x1,0x0)/Pci(0x0,0x0)/Pci(0x0,0x0)/Pci(0x0,0x1)
  • BRIDGE info:
  • IOREG Path:
  • IOService:/AppleACPIPlatformExpert/PC00@0/AppleACPIPCI/PEG1@1/IOPP/PEGP@0/IOPP/pci-bridge@0
  • DEVICE path: PciRoot(0x0)/Pci(0x1,0x0)/Pci(0x0,0x0)/Pci(0x0,0x0)
SystemInfo shows:

AMD Radeon Navi21:
Chipset Model: AMD Radeon Navi21
Type: GPU
Bus: PCIe
PCIe Lane Width: x16
VRAM (Total): 16 GB
Vendor: AMD (0x1002)
Device ID: 0x73af
Revision ID: 0x00c0
ROM Revision: 115-D412BS0-101

..in other words, the expected 73af, b/c I haven't patched it yet.

I'm happy to post a guide on my GitHub, but I am just not clear on what my next steps are - the steps I see in this thread are very abbreviated - more conceptual than anything. What must be done? I have maciasl, I've opened a ssdt-brg0 that I've downloaded, then ... not sure what's next. Here's the default ssdt-brg0:

/*
* This table provides an example of creating a missing ACPI device
* to ensure early DeviceProperty application. In this example
* a GPU device is created for a platform having an extra PCI
* bridge in the path - PCI0.PEG0.PEGP.BRG0.GFX0:
* PciRoot(0x0)/Pci(0x1,0x0)/Pci(0x0,0x0)/Pci(0x0,0x0)/Pci(0x0,0x0)
* Such tables are particularly relevant for macOS 11.0 and newer.
*/

DefinitionBlock ("", "SSDT", 2, "ACDT", "BRG0", 0x00000000)
{
// Fix this path
External (_SB_.PC00.PEG1.PEGP, DeviceObj)

// Fix this path
Scope (\_SB.PC00.PEG1.PEGP)
{
/*
* This is a PCI bridge device present on PEGP.
* Normally seen as pci-bridge in I/O Registry.

*/
Device (BRG0)
{
Name (_ADR, Zero)

/*
* This is an actual GPU device present on the bridge.
* Normally seen as display in I/O Registry.
*/
Device (GFX0)
{
Name (_ADR, Zero) // _ADR: Address
}
}
}
}

I compiled this, saved it into ACPI, added it to ACPI section in config.plist.

I've already added, in config.plist, the device ID bits:
DP
Add
PciRoot(0x0)/Pci(0x1,0x0)/Pci(0x0,0x0)/Pci(0x0,0x0)
^^^ is the above line right? Do I need to use something different based on the far-above output?
and then on the right side in OCAT:
device-id data BF730000
model string AMD 6900 XT (XTXH)

I either get all black screens, permanently, when going into MacOS with these mods (this isn't a pikeradp problem; without these mods it at least goes into MacOS, albeit without accelleration) or I get no changes. Seems like my most recent change (recompiling the asl above) led to a regression sending me to black screens. The change was the PC00 bit you see above, which I changed in order to match the output from my gfxutil output.

I'm now confused.

Help!
 
Last edited:
Fixed. My problem: Files compiled OK. My PCIroot command was missing one last set of 0x0's. After comparing again the start of the message (far above) with what I had in DP properties, I was able to fix it.

Whew!

Metal score: 194k. :)
 
That is a mangled and incorrect way to use percentages.

The CPU can only provide 100% when running at it’s maximum, with all cores/threads running at 100%. So the sensor saying the CPU is working at 270% is just nonsense. If it said 2.7 cores/threads were working at 100% that would be better, or gave that as a percentage of the CPU max, i.e. on a 6-core CPU 2.7 cores would be equivalent to 45% of the CPU’s maximum output.
Just a bit of feedback: that method of looking at CPU utilization (every processor, broken down by CPUs and cores, has its' own 100 percent percentage) has been the norm for Unix for eons. MacOS has origins in Unix, so...
 
Back
Top